Mérési adatgyűjtés és feldolgozás példák 2
A Fizipedia wikiből
A lap korábbi változatát látod, amilyen Geresdi (vitalap | szerkesztései) 2011. március 4., 15:53-kor történt szerkesztése után volt.
Véletlenszámok grafikus megjelenítése
A példaprogram működéséhez szükséges a zedgraph.dll fájl, amit itt lehet letölteni. A dll-t ezután adjuk hozzá a Toolboxhoz és a C# projekt referenciáihoz is (Solution Explorer -> References).
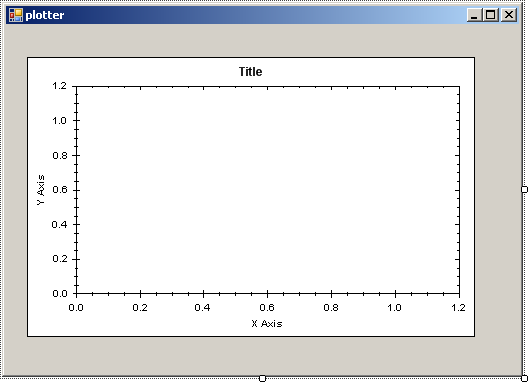
A Form tartalma:
- ZedGraph.ZedGraphControl zedGraphControl1
- Timer timer1
Kód:
using System;
using System.Collections.Generic;
using System.ComponentModel;
using System.Data;
using System.Drawing;
using System.Text;
using System.Windows.Forms;
using ZedGraph;            //hozzaadni!

namespace zedgraphplotter
{
    public partial class Form1 : Form
    {
        Random Rand01; //Globalis random objektum
        PointPairList graphPoints;  //globalis lista a megjelenitett pontoknak
        Double t;

        public Form1()
        {
            InitializeComponent();
        }
        private void Form1_Load(object sender, EventArgs e)
        {
            Rand01 = new Random();     //veletlenszamok inicializalasa
            graphPoints = new PointPairList(); //pontlista konstruktor
            GraphPane plot1= zedGraphControl1.GraphPane;
            //pontok megjelenitesenek a beallitasa
            LineItem graphLine = plot1.AddCurve("Felirat",graphPoints, Color.Blue,
						     SymbolType.Diamond);
            graphLine.Line.IsVisible = false;   //ha azt akarjuk, hogy ne legyenek osszekoto vonalak
            timer1.Interval=500;    //idokoz msec-ban
            t=0;
        }
        private void timer1_Tick(object sender, EventArgs e)
        {
            double x;
            t+=Timer1.Interval;  //idolepes
            x = Rand01.NextDouble();  //randomszam 0 es 1 kozott
            graphPoints.Add(t, x);
            zedGraphControl1.AxisChange();  //autoscale
            zedGraphControl1.Refresh();     //mindig kell!
        }
     }
}
