Superconductivity (Nobel Prize Physics in Everyday Application – Laboratory Exercise)
The theory of superconductivity in a nutshell
Dutch physicist Heike Kamerlingh Onnes was the first to carry out experiments at temperatures really close to absolute zero, after building his helium liquefier apparatus in 1911. Within a few months, his low-temperature measurements led to a very surprising discovery: he found that the resistance of a mercury wire drops to zero below 4.19 K temperature. Later it turned out that many materials (e.g. lead, tin, aluminium) behave as perfect conductors, so-called superconductors, at sufficiently low temperatures. Kamerlingh Onnes' work was awarded the Nobel Prize just two years later, in 1913.
After the discovery of superconductivity, it took almost half a century for the theory of the phenomenon to be formulated (J. Bardeen, L. Cooper, R. Schiffer - 1957, Nobel Prize: 1972). According to this theory, superconducting charges are pairs of electrons with special properties that propagate in a crystal in a different manner compared to simple electrons. The experimental study of the behaviour of the so-called Cooper pairs (Nobel Prize 1973) led to applications such as the creation of the most sensitive magnetic field sensor (SQUID), the world's fastest 'conventional' computers, or the prospect of quantum computers based on superconducting nanostructures.
Since Onnes's early discovery, superconductivity has been a constant focus of modern physics. This is reflected in the fact that, in addition to the above, Nobel Prizes were awarded in 1987 and 2003 for theoretical or experimental work on superconductivity. The Nobel Prize for superconductors at high temperatures (1987) is of particular importance, as it made it possible to achieve superconductivity at the boiling point of liquid nitrogen, which is considerably cheaper than liquid helium. The favourable properties of these new materials have also led to promising possibilities for superconducting motors and transmission lines.
The zero electrical resistance encountered in the superconducting state allows magnetic fields of several Tesla to be maintained by driving current into a superconducting coil. After the establishment of superconductivity, the power supply can be disconnected, and short-circuiting the ends of the coil results in currents (even 100 Amps or higher) circulating in the coil, with no damping in time, without additional external driving. Today, this principle is exploited in magnetically levitated trains, medical MRI (magnetic resonance imaging) machines or superconducting magnets in the CERN particle accelerator.
Another accompanying phenomenon of superconductivity is the so-called Meissner effect, discovered in 1933. Meissner and Ochsenfeld showed that:
- below a critical value, the magnetic field cannot penetrate into the superconductors, and
- materials cooled in a finite magnetic field squeeze out the magnetic field when they turn superconducting below the transition temperature.
The first property can be explained by the compensating magnetic field due to circular currents, which are induced by the time-varying external magnetic field and are not damped by the zero electrical resistance of the superconductors. However, the explanation of the second phenomenon goes beyond the scope of classical electromagnetics. Applying the theory to a superconducting ring, we expect that in the superconducting state, a magnetic field coupled perpendicular to the plane of the ring does not penetrate into the interior of the ring. In contrast, the magnetic field inside a superconducting ring remains inside the ring (“frozen” inside the ring) even after the external field is turned off.
Measuring magnetic field with a GMR sensor
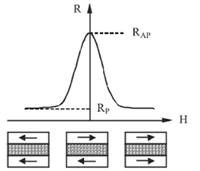
The magnetic field that builds up inside or escapes from the superconducting ring can be measured by a magnetic field sensor, which is also used in hard disk drive read heads. The operation of such sensors is based on the phenomenon known as the giant magnetoresistance (GMR), which was discovered by Albert Fert and Peter Grünberg in 1988, who were awarded the Nobel Prize in 2007 for their discovery. A nanostructure with GMR property is composed of two ferromagnetic layers separated by a thin non-magnetic layer (see Figure 1, bottom panel). By choosing the right materials and the right thickness of the non-magnetic layer, it is possible to achieve a magnetisation of the two layers in opposite directions in the absence of an external magnetic field. By coupling an external magnetic field of appropriate magnitude to this arrangement, the magnetization of the two layers can be rotated in the same direction (parallel). When the magnetization is parallel (P), the resistance of the layer structure is significantly lower than when it is antiparallel (AP), so that a significant reduction in resistance can be achieved by applying an external magnetic field. This phenomenon is called giant magnetoresistance.
| Figure 1. An illustration of the giant magnetoresistance. |
The underlying phenomenon is that the electrical conduction properties depend on the orientation of the spin (or magnetic moment) of conductive electrons relative to the magnetization of the ferromagnetic layer. The arrangement is somewhat similar to that of optical polarisation filters: crossed polarisation filters pass little light, while co-aligned polarisation filters pass a lot of light. It is important to note, however, that the GMR phenomenon only occurs in nanostructures, if the two magnetic layers are separated by a significantly thicker non-magnetic layer, by the time the electrons reach the second layer, they have already forgotten which direction of magnetisation they come from due to various interaction mechanisms. In this manner, the resistance of larger structures does not depend on the direction of magnetisation of the two layers. In the optics analogy, this is equivalent to placing a diffuse medium between the two polar filters that randomly rotates the polarization.
In the electronics industry, the first and still most significant use of magnetic resistance-based technologies is in the read head of hard disk drives. In the early 1990s, these used inductive read heads: information stored magnetically on hard disks was read out using a voltage induced in a small coil by a rapidly rotating magnetic disk. In the mid-1990s, with the transition to magnetoresistive technology, read heads based on anisotropic magnetoresistance (AMR) were the first to be introduced. Significant increases in storage capacity were achieved with AMR heads, but the small resistance variation (< 1%) of the AMR phenomenon became a major limiting factor later. The GMR phenomenon exceeds this value by an order of magnitude, and read heads based on the GMR phenomenon have been used in hard disk drives since the late 1990s. This has led to a further significant increase in the storage capacity of hard disks.
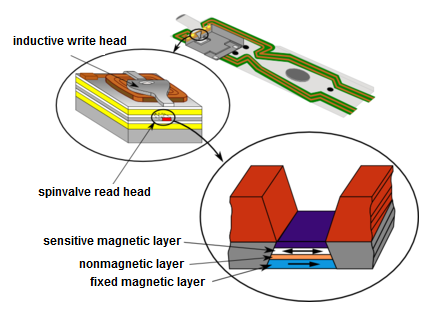
GMR read heads follow the so-called spin-valve arrangement. Of the two magnetic layers, one has a fixed magnetization with a pinned orientation (hard to rotate), while the other is a magnetic layer with free orientation (easy to rotate), as shown in Figure 2. The magnetization of the latter layer is adjusted according to the magnetization orientation of the bits stored on the hard disk (rotating under the read head), so that the information can be read out simply by measuring the resistance of the spin valve.
| Figure 2. Operation of hard disks based on the phenomenon of giant magnetoresistance. |
Measurement tasks
Safety regulations:
- Use extra care when handling superconducting samples during measurements as they are made of expensive and fragile materials.
- Superconducting materials are toxic to the human body, so do not eat during the measurement and wash your hands at the end of the measurement. Superconducting samples have a special coating on the surface so that no contamination can get on your hands if you handle them with your bare hands, but precautions are important.
- Be careful with liquid nitrogen, avoid getting it on your skin or clothes. Do not put your hands in it and you must not drink it! Do not touch objects cooled in liquid nitrogen with your bare hands!
Measuring the phase transition of a superconductor
In the following, you will measure the phase transition of a superconducting sample, tracking the resistance of the device as a function of time.
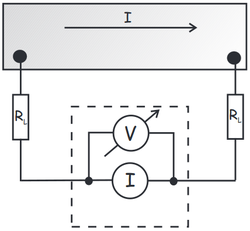
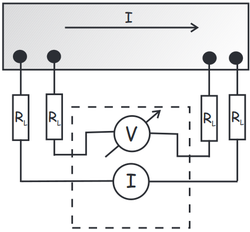
The resistance of the superconducting sample is very small in the normal state, a few tens of m . Therefore, if the resistance is measured at two points, the measured value will be dominated by the resistance of the contacts, as shown in Figure 3(a). These resistance values are not known. Even if we did know them, subtracting them from the measured value would still give a very inaccurate approximation of the actual resistance of the sample, so we perform the experiment using another method, called four-point resistance measurement (see Figure 3(b)). In this arrangement, the quotient of the voltage and current values read by the instruments will give only the resistance of the sample. You can check this at home with an easy calculation.
| Figure 3. a) Resistance measurement at two points. b) Resistance measurement at four points. | |
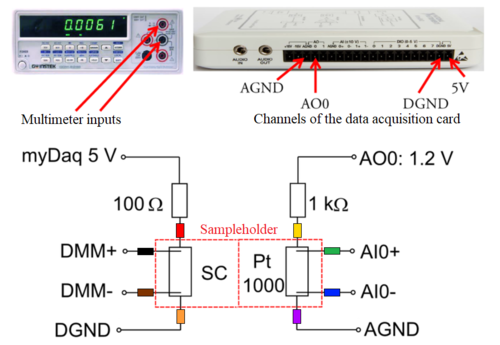
1. Assemble the measurement setup shown in Figure 4.
| Figure 4. Arrangement for measuring the superconducting phase transition of a small rod. |
Steps of assembly:
- Connect the data acquisition card and the multimeter to the computer.
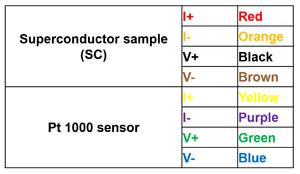
- The 8 wires required for the measurement (4 for the superconducting sample and 4 for the PT 1000 temperature sensor) are connected to the sample holder via an RS232 serial port connector/cable. The other end of the cable is cut open to allow the measurement circuit to be assembled. The wires are colour coded (and connected) as follows:
| Table 1. Colour coding of the inner wires of the RS232 cable leading to the sample holder. |
The grey wire of the RS232 cable is not in use.
- Connect the V+ (black) and V- (brown) connections for measuring the four-point resistance of the SC sample to the inputs of the multimeter. Connect the I+ (red) connection in series with a 100
 resistor to the 5 V output. Connect the I- (orange) wire to the DGND connection of the multimeter.
- Connect two of the temperature measurement cables (e.g., I+ yellow and I- purple) leading to the Pt 1000 sensor with a 1 k
 resistor in series to the AO0 and AGND outputs of the data acquisition card. The other two wires (e.g., V+ green and V- blue) should be connected to the AI0+ and AI0- inputs. Here, make sure that the wires that encode the negative polarity are connected to the AGND and AI0- outputs respectively.
2. Start the measurement control program! Run myDAQprogram.exe (located on the desktop).
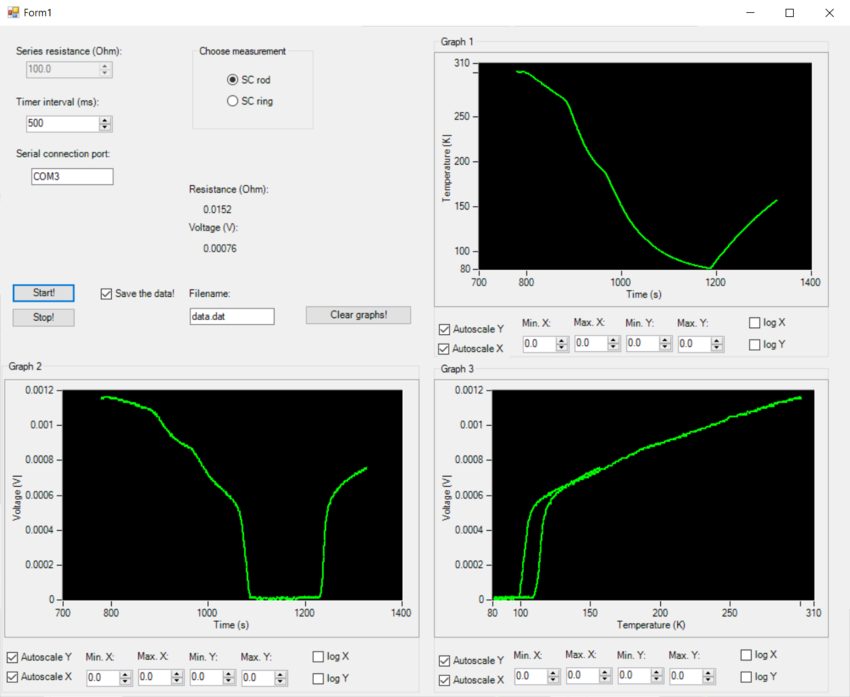
| Figure 5. User interface of the measurement control program. |
The user interface of the measurement control program is shown in Figure 5. The options "SC rod" and "SC ring" allow you to switch between superconducting rod and ring measurements. You will need the "SC rod" option first. You can start the measurement by pressing the Start! button and stop it by pressing the Stop! button. You can save the measurement data with the name given in the Filename text box. Stop the measurement while saving the data. If you start a new measurement, you can clear the graph data by clicking on the Clear graphs! button.
The program calculates the resistance of the PT 1000 type thermometer from the voltage applied to the thermometer + series resistance (1.2 V), and the voltage measured on the thermometer (measured at AI0+/-). The principle of operation of this thermometer is as follows: at a temperature of zero degrees Celsius, 1 k is its resistance, which decreases with decreasing temperature and increases with increasing temperature. Between -50 °C and 200 °C, the resistance-temperature relationship is approximately linear, and the measurement control program calculates the actual temperature based on this relation. At low temperatures this may not be true, so at the temperature of liquid nitrogen (77 K = -196 °C) this approximation introduces some inaccuracy into the measurement.
When you are ready, tell the instructor who will check your assembly and prepare the liquid nitrogen for you.
3. Using the measurement control program, record the temperature dependence of the four-point resistance of the superconducting sample by slowly immersing the sample holder into liquid nitrogen. Once the temperature has stabilized at the temperature of the liquid nitrogen, carefully lift the sample holder out and place it on the table and wait for it to warm up to room temperature. Also, while warming, measure the temperature dependence of the resistance. From the measured curves, determine the critical temperature for superconducting phase transition.
- Why do the transition temperatures measured during cooling and heating differ?
- What are the possible errors of temperature measurement?
- What is the error of determining the resistance of the sample? What is the maximum resistance that can still be measured as zero?
Meissner - effektus tanulmányozása
A következőkben egy szupravezető gyűrűben létrejövő perzisztens köráramot fogjátok tanulmányozni.
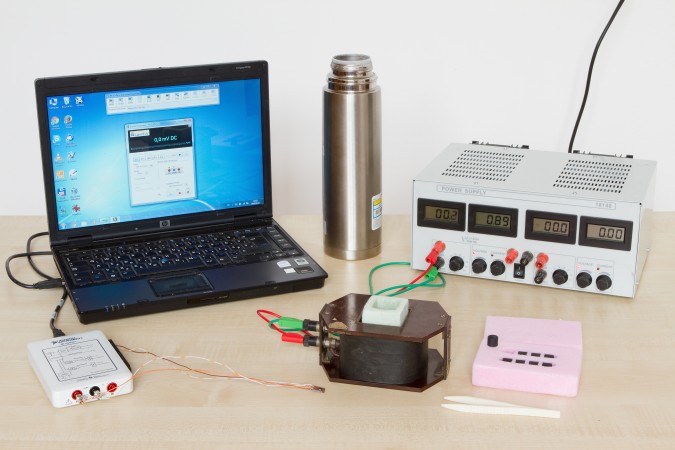
1. Állítsátok össze a mérési elrendezést a 6. ábra alapján!
| 6. ábra Szupravezető gyűrű vizsgálatának mérési elrendezése. |
Ennek menete:
- A mérőkártyáról válasszátok le az előző mérés eszközeit.
- A mágneses szenzor kék/barna kivezetését csatlakoztassátok a mérőkártya 5 V kimenetére, a kék-fehér/barna-fehér kivezetést a DGND kimenetre.
- A szenzor zöld/narancs és zöld-fehér/narancs-fehér kivezetéseit csatlakoztassátok a multiméter az AI 0+ és AI 0- bemeneteire.
- A táp kivezetéseit banánkábelekkel kössétek a tekercsre. A tekercsen eső feszültség mérésére a tekercs kivezetéseit az AI 1+ és AI 1- bemenetekre is kössétek rá.
- A mérésvezérlő programban válasszátok az „SC ring” opciót.
2. Számoljátok ki, hogy mekkora a mágneses tér a tekercs közepén a tekercsen eső feszültség függvényében! A tekercs menetszáma és ellenállása a tekercs oldalán olvasható, a hosszát tolómérővel mérhetitek meg.
Ha ezzel elkészültetek, szóljatok a mérésvezetőnek, aki ellenőrzi az összeállítást és a számolásotokat.
3. A műanyag csipesz segítségével helyezzétek a szupravezető gyűrűt az edény aljára, majd töltsetek folyékony nitrogént az edénybe. Ezután helyezzétek a GMR szenzort a gyűrű közepébe, és kapcsoljatok a tekercsre körülbelül 3.5 mT mágneses térnek megfelelő feszültséget. Mit mutat a szenzor?
- Mi az oka a jelenségnek?
4. Vegyétek ki a szenzort és a gyűrűt az edényből, utóbbihoz használjátok a műanyag csipeszt. Várjátok meg, míg a gyűrű felmelegedik, közben öntsétek vissza az edényből a folyékony nitrogént a termoszba. Ezután helyezzétek vissza az üres edényt és a mintát a tekercs közepébe, majd kapcsoljatok a tekercsre ismét 3.5 mT mágneses térnek megfelelő feszültséget. Öntsetek óvatosan folyékony nitrogént az edénybe, és helyezzétek vissza a mágneses szenzort. Kapcsoljátok le a tekercs által biztosított külső mágneses teret. A kikapcsolás pillanatától számítva az idő függvényében mérjétek a szenzor jelét legalább 10 percen keresztül! Közben ha szükséges, pótoljátok a folyékony nitrogént.
- Kikapcsoltuk a külső mágneses teret, mégsem mutat zérus térértéket a szenzor. Miért van ez?
- A mérés alapján adjatok felső becslést a gyűrű ellenállására!
- Az előző feladatrészben számolt zérus ellenállás hibájával kalkulálva mennyi idő alatt csökken le a gyűrűben a mágneses tér nullára?
5. Várjátok meg míg elfogy a nitrogén, és felmelegszik a gyűrű. Közben mérjétek a gyűrű közepében a teret.
Megjegyzés: ha precízebben szeretnénk elvégezni a mérést, akkor a GMR szenzort kalibrálni kell szobahőmérsékleten és alacsony hőmérsékleten is.
Függelék: A mérésen használt eszközök
- szupravezető pálca
- mintatartó hőmérővel
- myDAQ mérőkártya
- termosz
- folyékony nitrogén
- szupravezető gyűrű
- hungarocell edény
- tekercs
- mágneses szenzor
- műanyag csipesz
- tápegység
- banánkábelek
- csavarhúzó
- tolómérő
